
Updated August 1, 2026, 8:05 a.m. Pacific. Check the airport and CATSA for live traffic and wait times. Canadian terminals may have felt busier in June than they did in spring. Statistics Canada counted 5.2 million passengers passing through pre-board screening at the country’s eight largest airports, 0.6% more than in June 2025. The headline needs an unusually important footnote: a scheduled system upgrade stopped data collection for about nine hours on June 2, so the monthly total may be understated by roughly 1% to 2%.
I would read the release as evidence that summer demand remained high while travel patterns continued to diverge—not as proof that security lines were 0.6% longer. Screened traffic, screening wait time and an airport’s total passenger count measure different things. A connecting passenger who does not pass through security again is not captured here.
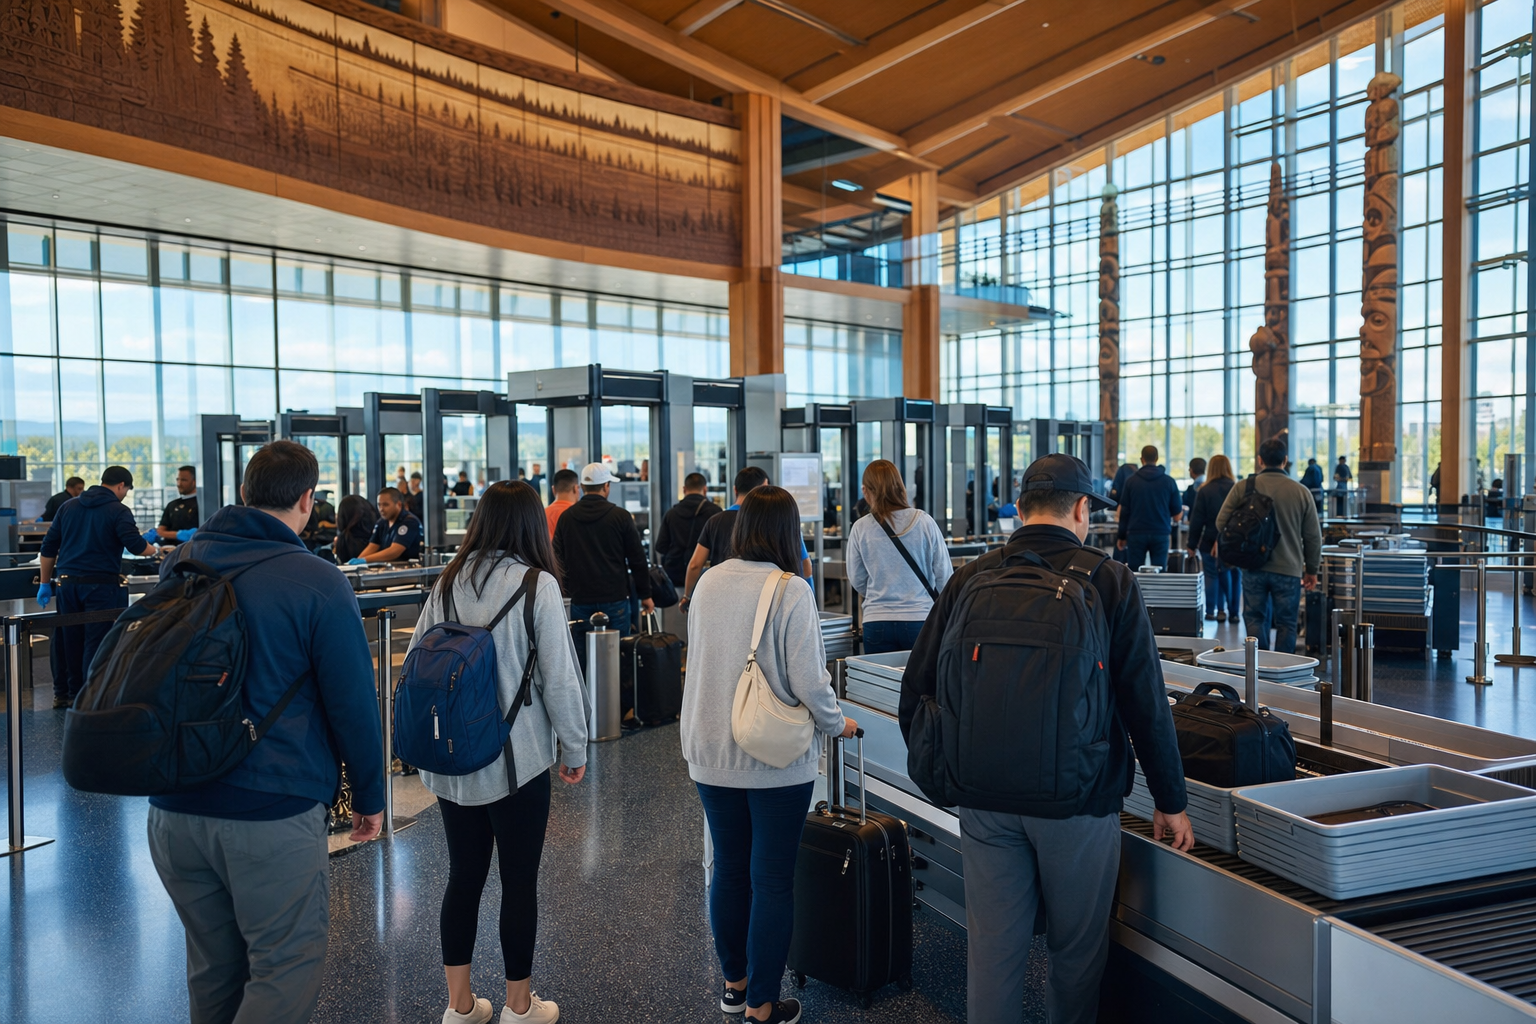
Domestic travel remained the largest segment at about 2.5 million screened passengers, up 1.8% year over year. International traffic outside the United States reached roughly 1.4 million, up 0.6%. U.S.-bound transborder traffic moved the other way: about 1.2 million passengers were screened, down 2.0% and marking the seventeenth consecutive year-over-year decline. Route capacity, fares, destination choices and international conditions all shape that mix, so the change should not be assigned to one cause.
| June screening stream | Passengers | Year over year | Useful reading |
|---|---|---|---|
| Domestic | About 2.5 million | +1.8% | Still the largest stream at the eight airports |
| International, excluding U.S. | About 1.4 million | +0.6% | Halifax grew sharply, but that does not describe every airport |
| Transborder to U.S. | About 1.2 million | -2.0% | Seventeenth consecutive annual decline |
| Eight-airport total | About 5.2 million | +0.6% | May be 1%–2% low because of the nine-hour data gap |
The World Cup makes the Toronto–Vancouver comparison interesting, but not causal. With matches in both cities, total screened traffic at Toronto Pearson rose 1.7% from June 2025 while Vancouver International slipped 0.5%. That shows the two gateways moved differently; it does not quantify how many passengers the tournament created. For U.S.-bound traffic, Pearson rose 0.7%—its first increase after 16 consecutive declines—while Vancouver, Montréal and Calgary fell 3.5%, 4.3% and 4.9% respectively.
For an August trip, the practical lesson is not to predict today’s queue from a national monthly average. CATSA updates its daily screened-traffic table weekly and counts both passengers and non-passengers. Its June operational update says 96% of passengers at the busiest airports waited less than 15 minutes over the previous year, including 91.7% during peak periods. Those are service results, not a promise. Use live airport, airline and CATSA information on departure day, and check carry-on and checked-baggage restrictions before packing.
Start planning with our Explore Canada travel hub. If you are arriving through Pearson, continue with our Pearson, UP Express and TTC guide. Our May Canada–U.S. travel analysis provides the preceding cross-border context. This is public transportation data reporting, so no affiliate link was inserted.
If your trip also includes the West Coast, use our Vancouver city guide for the route beyond the airport. Our complete 2026 World Cup review provides tournament context for the two host cities; neither link implies the tournament alone caused the screening changes.
The figures come from Statistics Canada’s July 31 release, checked against CATSA’s daily screened-traffic data, its June operational update and Transport Canada’s air-travel packing restrictions. The eight-airport series excludes aircrew and airport employees and is not the same as airport totals for enplaned, deplaned or connecting passengers.